Imagine staring at a massive spreadsheet, feeling overwhelmed by endless rows of numbers. Sarah, a marketing analyst, spent hours manually cleaning files until she discovered a better way. By learning to code, she transformed her tedious workflow into an automated engine.
This transition is becoming common in modern analytics. You will explore how this versatile tool simplifies complex tasks and builds predictive models. Mastering these skills is your gateway to a high-growth career.
Our roadmap provides a clear path to success. We focus on the core value proposition of using Python to handle data efficiently in professional environments. You are ready to begin your journey today.
Key Takeaways
- Understand why coding is essential for modern analytics.
- Learn to automate repetitive tasks to save time.
- Build predictive models that drive business decisions.
- Follow a structured roadmap to master technical skills.
- Gain a competitive edge in the job market.
Setting Up Your Python Development Environment
Before you start with complex algorithms, you need to set up your workspace. Creating a robust development environment is crucial for any data professional. It makes sure your code works well and keeps your projects tidy as you grow.
Installing Python via Anaconda
The Anaconda distribution is the top choice for Python for data science. It makes installing Python and hundreds of libraries easy. This saves you a lot of time compared to setting things up manually.
Using Anaconda helps avoid common problems beginners face. It gives you a clean space to learn without worrying about system errors. Efficiency is key when starting out.
Configuring Jupyter Notebooks for Data Projects
Jupyter Notebooks are a key tool for many experts. They let you mix code, math, and visuals in one document. This makes them great for documenting your Python for data science work.
You can install Jupyter with Anaconda Navigator or the command line. It lets you write code in cells and run them separately. This iterative workflow helps you test ideas fast and share them easily.
Managing Packages with Pip and Conda
Keeping your project’s dependencies in check is key for success. Both Pip and Conda are powerful tools for managing packages. While Pip is for the broader Python world, Conda is best for Python for data science.
Learning to use these commands is important. Proper dependency management stops version conflicts that can mess up your code. Getting good at these tools early will make you confident in handling any data project.
Mastering Python Syntax for Data Science
Knowing how Python works with data is key to turning raw info into useful insights. A strong grasp of syntax lets you work with data quickly and accurately. This knowledge keeps your scripts organized, scalable, and simple to fix as projects get bigger.
Understanding Data Types and Structures
Python has many built-in structures for your data projects. You’ll often use lists, dictionaries, and tuples to organize data well. The right structure depends on whether you need ordered sequences or key-value pairs.
| Structure | Mutability | Use Case |
|---|---|---|
| List | Mutable | Ordered collections of items |
| Dictionary | Mutable | Key-value data mapping |
| Tuple | Immutable | Fixed data sequences |
Writing Efficient Loops and Conditional Logic
Automation is key to effective data processing. Loops and conditional logic help you avoid writing the same code over and over. These tools let you filter data or do calculations on certain parts automatically.
“Programs must be written for people to read, and only incidentally for machines to execute.”— Harold Abelson
Mastering these logical flows reduces errors in your analysis. Efficiency in your code means faster project completion. This lets you focus on understanding results rather than fixing code.
Defining Functions for Reusable Code
Creating custom functions makes your analytical projects easier to manage. Instead of repeating code, you can use a single block of logic. This makes your work significantly easier to maintain and share.
Well-structured functions let you test parts of your workflow separately. As projects grow, this modularity is crucial for success. Writing clean, functional code is what makes a data scientist professional.
Essential Python Libraries for Data Science
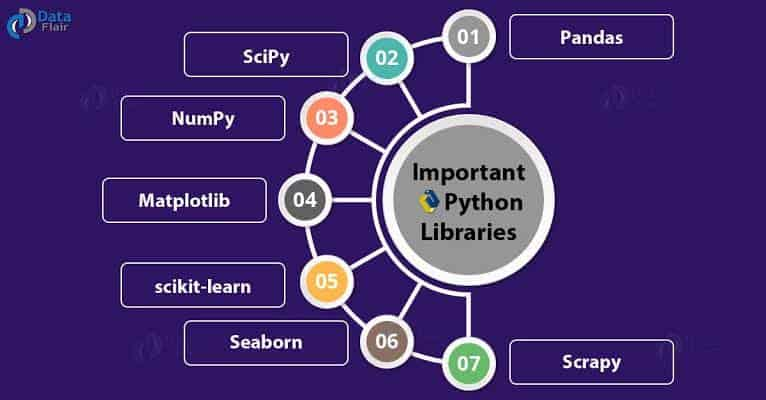
Unlock your data’s full potential with the top python libraries for data science. These tools are key for advanced math and data handling. They turn simple data into useful insights quickly.
Working with NumPy for Numerical Computing
NumPy is crucial for math in Python. It supports big, complex arrays and matrices. These are much faster than Python lists for complex math.
“The beauty of data science lies in the ability to turn chaos into clarity through the right computational tools.”
Manipulating Datasets with Pandas
After setting up your math base, you need to organize your data. Pandas is top for handling datasets. It makes working with data as simple as a spreadsheet, making it vital for python libraries for data science.
| Library | Primary Use | Key Feature |
|---|---|---|
| NumPy | Numerical Math | Multi-dimensional Arrays |
| Pandas | Data Manipulation | DataFrames |
| SciPy | Scientific Computing | Optimization Algorithms |
Handling Data Structures and Missing Values
Real data often has gaps or errors. You must find and fix missing values for accurate analysis. With built-in methods, you can cleanly fill or remove these gaps, a key step in any data project.
Using these python libraries for data science makes managing complex data easier. Regular practice helps you tackle common data challenges.
Performing Exploratory Python Data Analysis
Before diving into complex models, it’s crucial to understand your data’s story. Exploratory python data analysis helps uncover patterns and oddities in datasets. This step ensures your conclusions are solid, not based on guesses.
Loading and Inspecting Raw Datasets
To start, you need to import your data into your workspace. Python libraries for data science, like Pandas, make this easy. They let you load CSV or Excel files quickly.
After loading, check the first rows to see if the data looks right. Make sure numbers are correct and text fields are identified properly. This preliminary check helps avoid mistakes later on.
Cleaning Data for Accurate Insights
Raw data often has errors that can mess up your results. You must fix these problems by removing duplicates and handling missing values. Data cleaning is crucial but can be time-consuming.
Also, correct formatting errors like wrong date formats or extra spaces in strings. This makes your data consistent. By doing this, you lay a solid foundation for your statistical work.
Summarizing Statistics with Descriptive Methods
With clean data, you can use descriptive methods to summarize your findings. These methods give you a quick overview of your data, like the mean and standard deviation. Python data analysis tools make it easy to get these metrics.
These statistics help you find outliers and understand your data’s range. This knowledge guides your choice of models. Actionable insights come from combining these summaries with clear goals.
Creating Impactful Python Data Visualization
Turning numbers into stories is key for data pros. Good python data analysis means showing data in a clear, engaging way. With the right tools, you can make complex data easy to understand, helping make better choices.
Building Static Plots with Matplotlib
Matplotlib is the base for plotting. It’s great for making static charts like line graphs and bar charts. You can tweak everything, from labels to colors, for a perfect look.
Designing Interactive Charts with Seaborn
Seaborn builds on Matplotlib for more advanced plots. It makes creating detailed, interactive visuals easy. It’s great for showing trends and data connections with less code.
Choosing the Right Visualization for Your Data
Picking the right chart is crucial for python data visualization. Think about your data and what you want to show. Here’s a quick guide to help you choose:
- Line Plots: Best for showing trends over time.
- Scatter Plots: Ideal for identifying correlations between two variables.
- Bar Charts: Perfect for comparing quantities across different categories.
- Heatmaps: Excellent for visualizing intensity or density in large matrices.
Remember, the aim is to simplify complexity, not add to it. Choose the best visual to make your message clear and quick to understand.
Applying Python Statistical Analysis
Transforming raw numbers into useful insights is key with Python’s statistical methods. Python statistical analysis helps you go beyond simple observations. It lets you make informed decisions based on data, not just guesses.
Calculating Probability Distributions
Knowing the chances of different outcomes is crucial in python data analysis. Tools like SciPy help model various probability distributions. This way, you can see how your data is spread and spot any outliers.
“Statistics is the grammar of science.”Karl Pearson
Conducting Hypothesis Testing
Hypothesis testing is a way to check your assumptions about data. You start by setting up a null and alternative hypothesis. Then, you calculate a p-value to see if your findings are statistically significant.
If your p-value is less than 0.05, you can say your hypothesis is likely true. Tests like the t-test and chi-square test help ensure your results aren’t just random.
Interpreting Correlation and Regression Results
After validating your data, you can look at how variables relate to each other. Correlation coefficients show the strength and direction of a linear relationship. Regression models let you forecast future trends based on past data.
| Statistical Method | Primary Purpose | Python Library |
|---|---|---|
| T-Test | Compare two group means | SciPy |
| Pearson Correlation | Measure linear relationship | Pandas |
| Linear Regression | Predict continuous outcomes | Statsmodels |
| Chi-Square | Test categorical independence | SciPy |
Learning these techniques boosts your python data analysis skills. Using them consistently makes your reports reliable and impactful for your audience.
Introduction to Python Machine Learning
Python machine learning lets you make decisions and spot patterns automatically. It goes beyond simple stats to predict the future based on past trends. This way, you can turn basic data into actionable business intelligence.
Understanding Scikit-Learn Fundamentals
The Scikit-Learn library is key for machine learning in Python. It has a standard interface, making it easy to switch between models without rewriting code. This is crucial for trying different solutions to a problem.
Scikit-Learn makes it simple to do regression or classification. You define your model, fit it to data, and then predict outcomes. This process fits well with python data visualization, letting you check your model’s logic.
Implementing Supervised Learning Models
Supervised learning uses labeled data to train models. You give the algorithm input and the correct answers. Over time, it learns the patterns between these variables.
Examples include linear regression for continuous values and classification trees for categorizing data. These methods help solve big business problems like predicting customer churn or forecasting sales. It’s important to have clean, real-world data for training.
Evaluating Model Performance and Accuracy
Creating a model is just the start; you must test its reliability. Always check your model against a separate validation dataset. This stops overfitting, where a model works well on training data but fails on new data.
To check how well a model does, use several metrics:
- Accuracy: The percentage of correct predictions.
- Precision: The model’s ability to find only relevant instances.
- Recall: The model’s ability to find all relevant cases.
By looking at these metrics, you can tweak your model to do better. Continuous evaluation keeps your machine learning solutions strong and effective as your data changes.
Leveraging Advanced Python Data Science Tools
To grow in data science, you need to learn the top tools used today. Basic scripts are good, but you need a full set of python data science tools for big projects. These tools help you work better with others and make your projects ready for real use.
Utilizing Google Colab for Cloud Computing
Google Colab is a great tool for working in the cloud. You can run code right in your browser, no need for a powerful computer. It gives you free access to GPUs and TPUs, which are key for python machine learning tasks. Plus, it’s easy to share your work with others, making it perfect for team projects.
Integrating SQL Databases with Python
In real work, data isn’t just in CSV files. You often need to get data from databases. With python libraries for data science like SQLAlchemy or pandas, you can write SQL queries in your code. This makes your data work flow smoothly as your project gets bigger.
Version Control for Data Projects with Git
Keeping track of your code changes is key for data pros. Git lets you see every change you make. This way, you can try new things without worrying about losing your work. Using GitHub or GitLab helps keep your projects organized and makes sharing open-source python data science tools easier.
| Tool Category | Primary Benefit | Best Use Case |
|---|---|---|
| Google Colab | Cloud-based GPU access | Heavy model training |
| SQL Databases | Efficient data retrieval | Large-scale data storage |
| Git | Version history tracking | Collaborative development |
Best Practices for Writing Clean Data Code
Improving your coding skills is easier when you follow industry standards. Clean code ensures your python data science tools work well over time. It shows you value long-term success and teamwork.
Documenting Your Analysis with Markdown
Jupyter Notebooks are great for mixing code and text. Markdown cells help explain your code, making it easier for others to follow.
- Use headers to organize your notebook into logical sections.
- Include bullet points to summarize key findings or data limitations.
- Add links to external documentation for complex algorithms.
Refactoring Code for Readability
Refactoring makes your code better without changing how it works. It boosts performance and makes scripts easier to understand. Simplifying functions helps avoid bugs and makes your work easier for others.
Here’s a table showing messy code habits versus professional standards:
| Practice | Messy Approach | Clean Approach |
|---|---|---|
| Variable Naming | Single letters (x, y) | Descriptive names (user_age) |
| Function Length | Over 50 lines | Under 20 lines |
| Comments | None | Docstrings for every function |
Following these standards makes your python statistical analysis easier to reproduce. Clean code lets you work faster and share your findings with confidence.
Debugging Common Data Science Errors
Even pros face errors in data projects. Start by finding the exact code causing the problem. This helps you focus your search.
Good debugging means checking your data and inputs. Make sure your data is right before you try to visualize it. Remember, patience is key when dealing with unexpected results.
Building Your First End-to-End Data Project
Creating a comprehensive, end-to-end project is the key to becoming a skilled data scientist. This hands-on experience is the best way to show off your skills. It helps you understand the whole data lifecycle, from start to finish.
Defining Your Research Question
Every project starts with a clear research question. You need to find a specific problem or hypothesis to solve. This step keeps your Python for data science work focused and meaningful.
Think about how your findings could impact a business or research goal. A well-defined question guides you through data collection and interpretation. Without it, you might get lost in complex datasets.
Acquiring and Preparing Your Dataset
After setting your question, you start gathering and preparing data. You’ll use public repositories, APIs, or internal databases. Cleaning the data is crucial to ensure your python statistical analysis is accurate.
Feature engineering transforms raw data into useful variables. This process requires testing to find the best inputs. Attention to detail here prevents errors in your models.
Presenting Your Findings to Stakeholders
The last step is to share your results with stakeholders who might not understand technical details. You need to make complex data easy to understand and useful for decision-making. Visualizations help explain the data in a clear way.
Your presentation should focus on the key takeaways while keeping technical accuracy. By emphasizing the practical value of your analysis, you ensure your work is valuable to your audience. Here’s a table showing the main phases of your project.
| Project Phase | Primary Goal | Key Tool |
|---|---|---|
| Problem Definition | Set clear objectives | Research Logic |
| Data Preparation | Clean and structure | Pandas |
| Statistical Analysis | Identify trends | SciPy/Statsmodels |
| Communication | Share insights | Matplotlib/Seaborn |
Conclusion
Your journey into data analysis begins with programming basics. You now know how to work with datasets and find important insights. This is done using methods widely accepted in the field.
Using python machine learning, you can tackle complex issues with accuracy. You can create predictive models that add real value to your work or personal projects.
To stay up-to-date, keep practicing with the latest python data science tools. Look into new libraries and frameworks to keep your skills sharp.
Having a diverse portfolio is key to showing off your skills to employers. Share your code on GitHub to show you can handle all parts of data workflows.
Join the community to share ideas and solve tough problems. Your dedication to learning will help you succeed in this exciting field.
FAQ
Why should you choose Python for data science over other programming languages?
Python is the top choice for data science because it’s easy to read and has many tools. It helps you go from handling big datasets to making complex models. This makes it easy to learn the skills needed for data jobs.
Why is the Anaconda distribution recommended for setting up your development environment?
Anaconda makes setting up your environment easy. It comes with Jupyter Notebooks for interactive documents. It also has Conda and Pip to manage your project needs.
What are the primary python libraries for data science you need to master?
Focus on NumPy for numbers and arrays, and Pandas for data cleaning. These libraries are key for working with real data, fixing missing values, and making data useful.
How do you perform effective exploratory python data analysis?
Start by loading and checking your data. Clean it by removing duplicates and fixing errors. Then, use statistics to summarize and find patterns in your data.
Which tools are best for creating impactful python data visualization?
Matplotlib is great for basic plots. Seaborn is better for interactive charts. Choose based on your data and what you want to show.
What role does python statistical analysis play in your projects?
Python stats help you make informed decisions. It lets you test hypotheses and check if your results are significant. This makes your conclusions strong and trustworthy.
How can you get started with python machine learning?
Start with Scikit-Learn for machine learning. Learn to use models like linear regression. Use metrics to check how well your models work.
What are some advanced python data science tools for scaling your projects?
Use Google Colab for cloud computing and SQL for big datasets. Git is key for tracking your code and working with others.
How can you ensure your data science code remains clean and maintainable?
Use Markdown in Jupyter Notebooks for notes. Make your code easy to read and debug. This keeps your code professional and understandable.
What are the essential steps for building your first end-to-end data project?
Start with a clear question. Get and clean your data. Then, share your findings in a way everyone can understand.